Monnai: A Product Launch Journey
Reinventing Global Consumer Insights for Fintech
OUTCOMES
11
Countries
17
Data Partner Integrations
3
Months For Going Live
92%+
Automatically Tested
$6.5
Million of Funding In Year One Of Going Live

BACKGROUND
Client
Monnai
Industry
Fintech
The fintech market size stood at USD 112.5 billion in the year 2021. Yet, consumer data used for decision-making remain outdated and fragmented. Most provide limited data points and do not even work across countries and continents.
Monnai is on its way to changing this by providing over 500+ global and standardized consumer insights, which may be a better predictor than just one’s Social Security Number or similar other identifiers.
WHAT WE DID
A carefully selected tech stack, high levels of automation, and following best practices from day one, helped us achieve the following for Monnai:
Go to market in three months
The ability to respond quickly to feedback from potential customers
Onboarding their first customer within six months
Sustained frequent releases to ensure the product evolved rapidly and incrementally
An amazing team morale
$6.5 million of funding in just one year of going live.

We went from an initial call with Incubyte to starting work in under 15 days and from an idea to a working MVP in just three months. They started from scratch, setup our cloud infrastructure around high availability, performance and security, and helped us implement the right stack with the right setup. Their focus on best practices ensured that our product continued to evolve rapidly while we build our internal team in parallel. The well written code also made onboarding internal engineers smooth. Overall, they got us started on the right foot. They stood out as an agency that focussed heavily on quality in addition to just getting things done. We learnt a lot from Incubyte and would recommend them as engineering partners for any start-up launching new products.


Ravish Patel, Co-founder at Monnai
PROJECT HIGHLIGHTS
1.
Defining A Vision For The Product And The Partnership
2.
Automation, Automation, Automation
3.
Cloud Infrastructure
4.
Observability And Monitoring
1. Defining A Vision For The Product And The Partnership
The First Seven Seconds
Monnai had a very clear vision of how they wanted to change the fintech industry when they started. To jump-start their development, they decided to engage Incubyte in parallel with creating their internal engineering team. We were able to get from a sales call to starting work in under 15 days.
As Green As It Can Get
Starting with a blank slate, in this case, a blank Confluence page, wouldn’t be a wrong statement when we started the project. The Monnai team had initial ideas on the endpoints they wanted to create to support their API business, which we started building on.
Such greenfield projects can cause imaginations to run wild and in our experience, we have seen projects accrue technical debt very fast as the team size and product complexity increase.
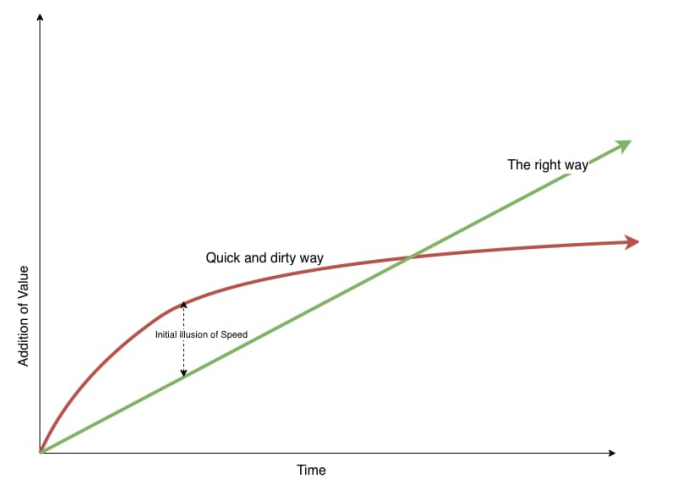
That’s why our focus was on the right practices like TDD and automation from day one, while we worked closely with the client to uncover the thinnest slice that could become an MVP. The aim was not only to go to market quickly but to also enable sustainable growth of the feature set as time passes.
The productivity pattern of a growing company typically looks like the following, exponential at first and then a dip!
2. AUTOMATION, AUTOMATION, AUTOMATION
Walking Skeleton
Most teams do not take up ops work like build, deployment, infrastructure allocation, and database versioning until the very last moment. This becomes a reason for hurdles at the later stages of PDLC.
Starting with a walking skeleton of the software ensures smooth deployments from the very beginning since every component needed for the software architecture and practices is made available. This includes, at the very least, automated builds, code scans, testing, database upgrades, and code deployment.
Essentially we started by automating the process along with every component needed to achieve the end architecture.
Test Strategy
First, there was TDD! We have been practicing outside-in TDD for some time. While TDD enabled us to achieve high code coverage and incremental evolution of the architecture, the missing pieces causing project delays were because of lack of collaboration, high cost of coordination, failure to agree on things, longer test cycles, etc.
This is why we decided to layer on BDD and the Three Amigos working model for the Monnai engagement. We took the QA function, which typically occurs almost after all work is done, and shifted it all the way left in the timeline. That meant we started automating test cases and involved all three amigos - analysts, developers, and QA, in the discovery process itself.
This increased buy-in from all stakeholders and reduced back and forth between the proverbial walls.
Automated Fault Tolerance
We knew that we won’t have the luxury of a “maintenance window” due to customers being located worldwide. So we designed our components in a way that any new deployment will create and start a server, make sure it is ready to accept traffic, only then route traffic to new servers, and then destroy old servers. This allowed us to deploy without any downtime, even in peak traffic conditions.
But, what if servers crashed or worse, what if a server is running but for some reason, not accepting the traffic? We put a liveness probe to each component that checks if the server can accept traffic, and if not, restart it. Also, there are always two load-balanced replicas in case of a server failure.
But wait, there is more! What if servers receive requests such that memory or CPU consumption shoot up? We put in horizontal scaling such that before an overload, a standby server is started and makes itself ready to serve the increased traffic. The mechanism will kill the extra instance once a dip in traffic is observed.
3. CLOUD INFRASTRUCTURE
We emphasize automation everywhere. Not just artifacts, and testing, but infrastructure should be automated as well. We use Terraform to create and manage the infrastructure. It has served us very well so far, eliminating any chance of human error in creating infrastructure.
Human errors are not limited to system crashes, but security lapses as well. A security lapse can cause more damage than other system issues. Since the infrastructure is in code, and each code change (read infrastructure change) is peer-reviewed and scanned automatically by a code scanner, there are fewer chances of deploying vulnerable infrastructure.
As a bonus since everything is automated, replicating an environment became trivial too.
4. OBSERVABILITY AND MONITORING
Due to the dynamic nature of components and the need for our system to communicate with multiple external data sources, we had to employ elegant observability solutions. We rely on proprietary solutions that support open-source implementation to avoid vendor locking.
Logs
All logs are captured and sent to a centralized server for query and review. Such centrally aggregated logs make your humdrum data insightful and real-time!
Metrics
Different levels of metrics like CPU, memory, threads, number of requests, number of active servers, etc. are collected and sent to a centralized server. A custom-made dashboard helps keep an eye on the health of infrastructure and become proactive as opposed to reactive!
Traces
Observing one API call is difficult as we have a distributed system with several internal and external endpoints. We capture and store traces of each call and allow developers to view the whole tree in a nice graphical way so that debugging and finding the cause of failure or slowness becomes easy.
Alarms
None of these are helpful if a person has to sit and analyze logs, traces, or metrics manually, we believe in automating these as well. Any anomalies like errors in logs will throw an alarm email to relevant stakeholders.
*All the metrics in this case study are accurate as of the time of publishing.
Other case studies you may be interested in
Taking Mental Healthcare Solution Global
Making Mental Healthcare Accessible by Expanding the Solution Globally and Providing a Personalized Customer Experience
READ CASE STUDYModernizing A Legacy System: Build And Deployment
Streamlining Expense Tracking Process by Modernizing a Solution for a US-Based Expense Management Solution Provider
READ CASE STUDY